I spent the final days of 2019 scrapping all Cowrywise’s tweets from January through December in 2019, taking special consideration for such high trending hashtagged tweets as #CowrywiseRoundUp, #SimplifiedbyCowrywise, and #Cowrywise itself.
Why?
I’d been curious as to how much the #CowrywiseRoundUp strategy had increased engagement on twitter, in comparison to their other trends and activities before then (January 2019
- November 2019), and perhaps be able to predict how 2020 might look like for them (Not yet certain how to do that though.. Lol).
After wrangling, I plotted some exciting graphs to show frequency and stuff. Then, I performed sentiment analysis on every single tweet, and plotted graphs for these as well.
Note that every tweet had the hashtags: #CowrywiseRoundUp, #SimplifiedbyCowrywise, and #Cowrywise with them.
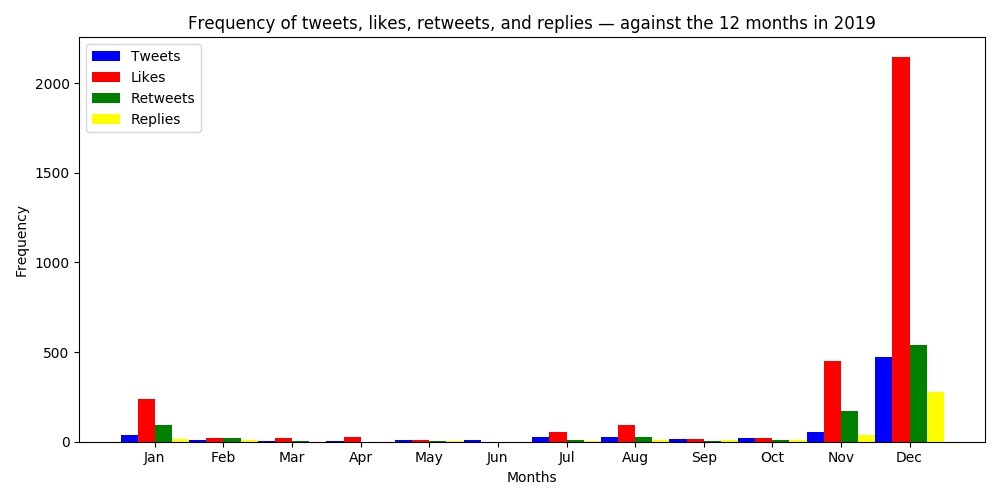
First, I plotted the frequency of all the tweets, likes, retweets and replies against each month in 2019

See how much engagement happened in December? Somewhat equivalent to the sum of all the other months (January to November) put together.
Very interestingly, the #CowrywiseRoundUp campaign began in mid-December. See the dates of the first ten #CowrywiseRoundUp tweets below:
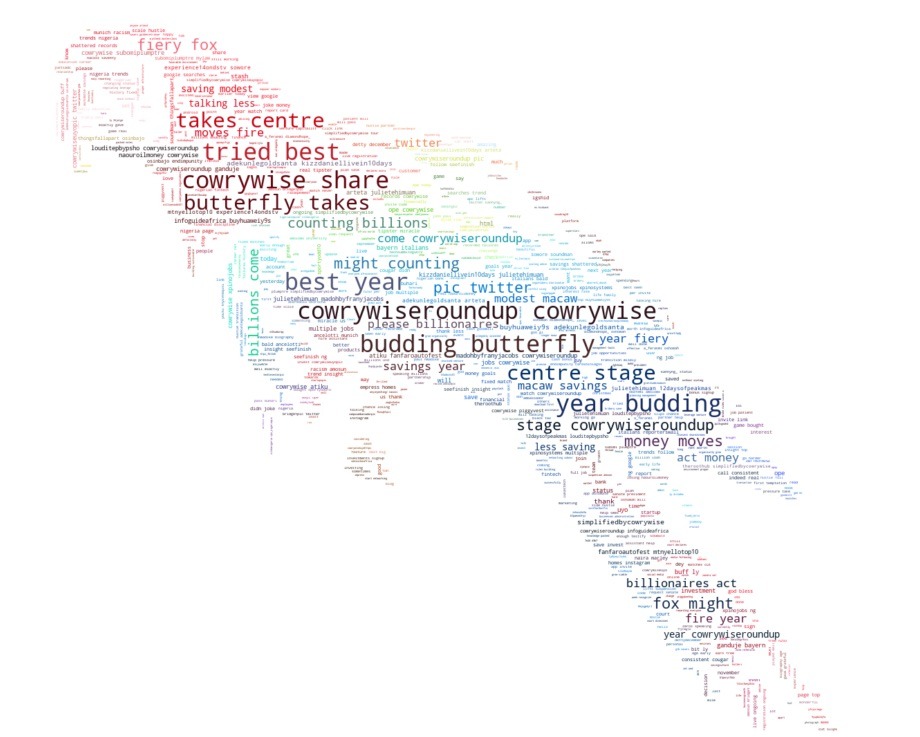
Next, I plotted a wordcloud for every tweeted content. This is a representation
of the text data displaying word frequency (most consistent words across all
2019 tweets with most of the hashtags):

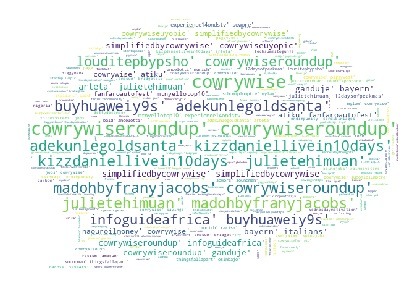
I also plotted a wordcloud for hashtags frequency as well:

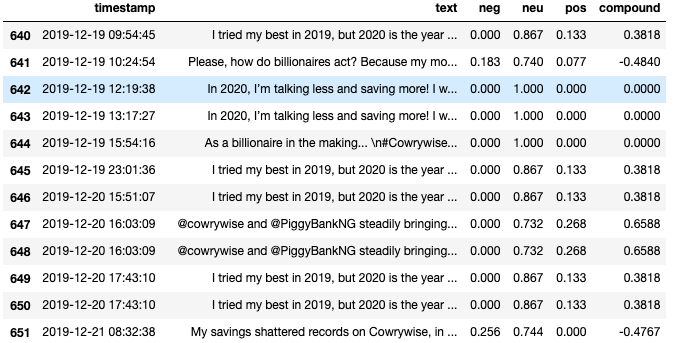
Next, I performed Sentiment Analysis on all tweets, concatenating new columns of positive,
negative, neutral, and compound sentiment scores from -1 to 1. See what that looks like:

A bit of sentiment error very visible here, as sentences like, “Please how do billionaires act? Because my money moves were on fire this year..” were counted as negative.
“Money”, “on”, “fire” — bad stuff, yeah.. You get?
Wasn’t certain how to appropraitely fix that yet, so I just continued. Lol, I was having fun.
Then, I plotted the sentiment analysis on a scattered graph:
Here, the timestamp is plotted on the x-axis against the sentiments. Be aware that the part of the graph where the red line becomes a bit stable is sometime around that mid-December when the #CowrywiseRoundUp began.
It’s safe to say that even though there was a number of negative sentiments, there were a lot more positive and neutral (neutral is good) sentiments. Hence, overall, [very] good embrace from people.
Finally, I plotted compound sentiment graphs.
First, a compound sentiment score of the entire dataset:
Followed by the compound sentiment score of only the tweets containing the hashtag #Cowrywise.
Note that there are tweets that contain more than one hashtags. In the case of #Cowrywise, most
of her tweets had other hashtags with them.
Then, the compound sentiment score of only the tweets containing the hashtag #SimplifiedByCowrywise
And finally, the compound sentiment score of only the tweets containing the hashtag #CowrywiseRoundUp
And although, I may be wrong, my deductions from all of the above are:
- The Cowrywise RoundUp strategy worked amazingly for Cowrywise’s PR. The hard work reaped great harvest for their public perception and trust. However, I have no idea what this interprets in direct/indirect marketing goals for Cowrywise, and may be surprised to find that it’s another story entirely — the way marketing works and all
- I somewhat feel that the team at Cowrywise had planned this strategy from the very start of 2019. That perhaps, it was intentional to go lean on SM (mostly Twitter), and then hit hard during that time. But then, maybe not. Maybe it just came up with the RoundUp idea.
- They should not do this again. Or at least, not anytime soon. It was a great Zig. Now, they should Zag. The public perception and trust is very healthy at the moment, so they should be more consistent and very levelled now.
